Average U.S. e-commerce return rates actually: 2026 Strategic Reality
Average U.S. e-commerce return rates in 2026 are hovering between 15% and 30% of online orders, with 17.6% being the baseline average for standard retail. However, for pure-play digital brands, the reality is far more aggressive. With total annual return volumes crossing $740 billion, the industry has shifted from a “growth at all costs” mentality to a mandatory focus on sustainable profitability and decisional infrastructure.
Key 2026 E-commerce Return Trends & Data
The current landscape is defined by a widening gap between low-friction categories and high-volatility sectors:
- The Apparel Crisis: Clothing remains the highest return category, with rates frequently reaching 30–40% due to chronic sizing issues and persistent “bracketing” behavior.
- Sector Breakdown: While Electronics maintain a lower 8–10% rate, Shoes (17%) and Home/Furniture (15–20%) continue to face significant logistical headwinds.
- Return Channels: The “BORIS” (Buy Online, Return In-Store) model now accounts for 59.5% of all e-commerce returns, as brands attempt to recoup foot traffic from digital losses.
- Fraud & Risk: Nearly 12% of return attempts are now flagged as high-risk or fraudulent, forcing a tightening of return windows across 81% of major U.S. retailers.
The “Averages Trap”: From Historical Data to Decisional Shifts
In 2026, relying on historical averages is a liability. Most retailers are merely reacting to high volumes by tightening policies—a move that often alienates the customer. The real competitive advantage is found in Decisional Analysis. By analyzing the “decision path” rather than just the return data, e-commerce leaders in the U.S. are taking the necessary steps to pause the return cycle while simultaneously increasing net sales and benefit.
Disruptive Intelligence: The 2026 AI Agent Leap
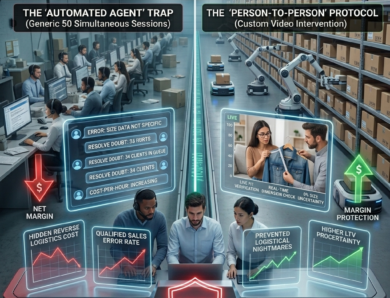
The “Unique Leap” we are seeing this year is the deployment of Autonomous AI Agents designed to intervene at every stage of the consumption cycle. This is no longer a future prediction; it is current operational infrastructure:
- Pre-Purchase (The Informative Filter): AI agents now provide hyper-personalized fit synthesis and 360-degree digital clarity that eliminates the need for “bracketing.”
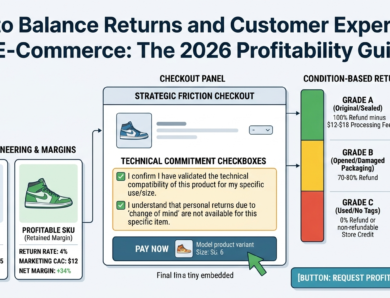
- The Delivery Moment (Friction Neutralization): Implementing specialized informative triggers exactly at the moment of entry. These agents guide the customer through the unboxing and setup, reducing initial “buyer’s remorse.”
- Post-Purchase (Profit Recovery): Real-time AI intervention that offers technical support or localized exchanges before a return label is ever printed.
Future Outlook: Predictive Prevention
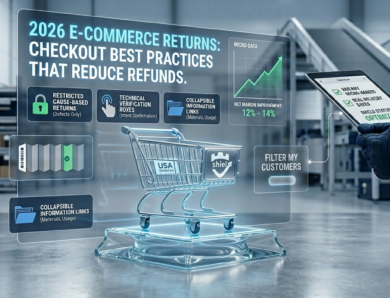
As we move through 2026, the velocity of AI growth is enabling a shift toward Predictive Prevention. We expect considerable improvements in net margins as each e-commerce platform implements niche-specific improvements tailored to their unique customer base.
- Agent-Led Consumption: AI will act as a “concierge” that ensures the product in the cart is the product that stays in the home.
- Behavioral Modeling: Brands will use real-time data to identify high-risk return patterns before the order is fulfilled, allowing for proactive customer education.
| Product Category | 2026 Return Rate | Tactical AI Intervention |
| Apparel/Clothing | 30% – 40% | Agentic Fit-Mapping & Bracketing Shield |
| Shoes/Footwear | 17% | Biometric Size Synthesis Agents |
| Home & Furniture | 15% – 20% | Spatial AR Visualization Agents |
| Consumer Electronics | 8% – 10% | Interactive Setup & Support Agents |
The USA Opportunity: Efficiency as the New Growth
The U.S. e-commerce return rate is no longer a cost of doing business—it is a solvable engineering problem. While the average retailer is busy tightening policies, the elite 1% are using AI to solve the root causes of return friction. By implementing these specialized improvements—pre-purchase, during delivery, and post-purchase—brands are finally achieving the “Unique Leap”: reducing returns, increasing customer satisfaction, and protecting the bottom line in a $740 billion market.
EXCLUSIVE ACCESS: OPERATIONAL ENGINEERING BLOCK 1
We don’t want you to invest in a full $3,000 system without first seeing the cash return to your balance sheet. We want the results to fund your transformation.
For this reason, exclusively through this article, we are granting independent access to Block 1.
- Investment: $497 USD.
- Purpose: Immediate tactical implementation on one critical SKU.
- Effect: A reusable asset designed to be 100% effective from week one.
The protocol is simple:
- Acquire Block 1.
- Implement it on a single product in your catalog.
- Visualize the results.
Once you verify the effectiveness of this first maneuver and see the clear improvements, you will be ready to scale the system to the rest of your operations. This is a zero-risk upgrade: let the margin we rescue today pay for your operational excellence tomorrow.
Our Engineering Guarantee: This protocol comes with a total refund policy. If it doesn’t meet our efficiency standards, we will return your investment. It does not matter when you purchased the product; if it doesn’t work for you, we don’t want your money.